Change units with slicers
Today I will show you a simple solution enabling the change of units/currencies or other perspectives using slicers. This will make a report more responsive and cleaner. From my experience, customers will be able to find the insights they are after much quicker. The end effect will look like this:
After setting up a conversion table your options are endless. You can insert different currencies, units, types of measurements. The number of those is not restrained in any way neither.
In my dashboards I use it very often to show different currencies in the same field. Something like this:
In this tutorial I am using a sample sales data I have downloaded from here.
To get the solution running, please follow these steps:
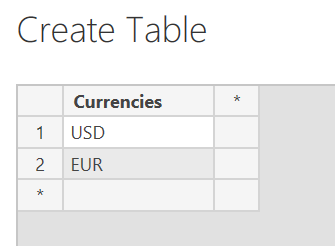
First, create a support table with names of the units e.g. USD and EUR, value and volume etc.
To do that click Enter Data:
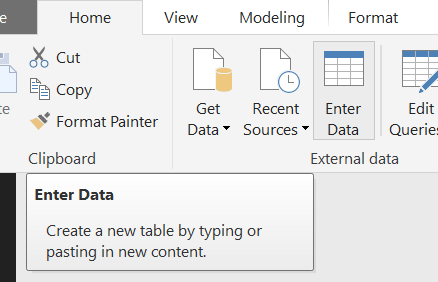
Enter units/currencies that are important to you.
After creating the table, select new measure. This is the most important step, as the calculation will happen in the DAX query.
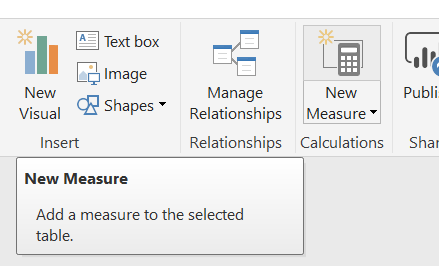
If you use the data for example, you can type something similar:
|
1 |
Measure = IF(VALUES('Conversion 1'[Currencies]) = "USD", FORMAT(SUM('Sample data (2)'[UnitCost]),"$#,##0.00;($#,##0.00)") ,FORMAT(SUM('Sample data (2)'[UnitCost])*0.8,"#,##0.00€;(#,##0.00€)")) |
This part checks, which currency is filtered. Basing on this logical test we will proceed with the calculation:
|
1 |
VALUES('Conversion 1'[Currencies]) = "USD" |
If value is indeed USD, we choose to return:
|
1 |
FORMAT(SUM('Sample data (2)'[UnitCost]),"$#,##0.00;($#,##0.00)") |
Otherwise, we choose to return:
|
1 |
FORMAT(SUM('Sample data (2)'[UnitCost])*0.8,"#,##0.00€;(#,##0.00€)")) |
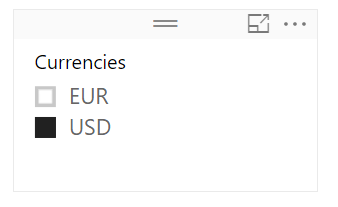
After setting up a measure, create a slicer using the newly created conversion table.
To view your data, create a card with the new measure.
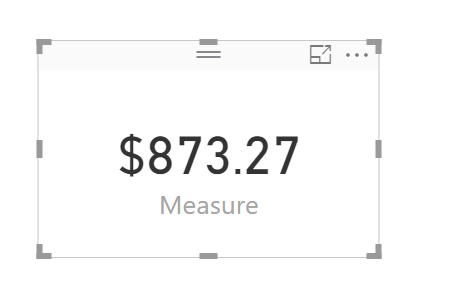
As you click the filters the value changes!
To create the same effect on the charts, remember not to use any string formatting as it will interfere with PowerBi engine.
Thanks!