Cumulative total by product in DAX

This is a case that I have come across with one of my customers very recentely. I wanted to calculate sum of sales generated by first N products pareto style i.e. if first product’s sales is 200 and second’s 100, my calculation would show 200 for the first product and 300 for second. This allowed me to see that e.g. 90% of our total sales are generated by 7 products.

Authenticating to a datasource with multiple credentials

The case from one of my previous comments had another catch! As I mentioned the client was downloading data from an API. The client was interested in data for multiple entities i.e. had to use different credentials for the same URL to retrieve different datasets. Because the client wanted to see everything in one Power BI I had to find a suitable solution. Same as before, I turned my attention towards M language!

Change units with slicers

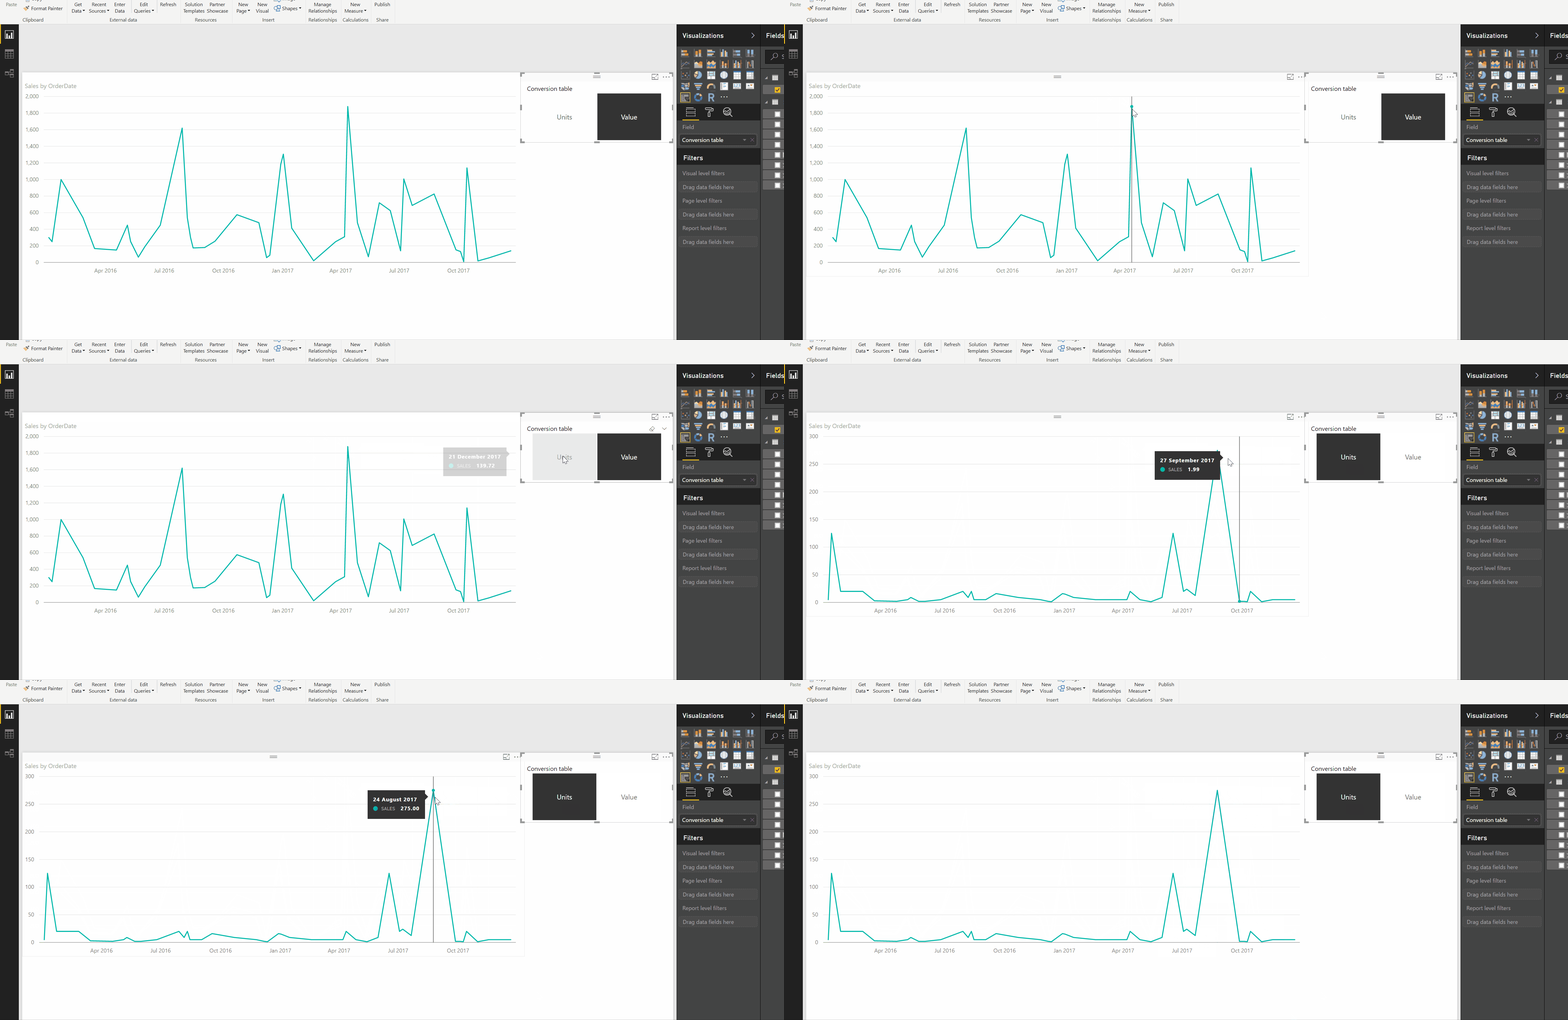
Today I will show you a simple solution enabling the change of units/currencies or other perspectives using slicers. This will make a report more responsive and cleaner. From my experience, customers will be able to find the insights they are after much quicker. The end effect will look like this: